
Chinese economic activity was expected to accelerate to start 2023 and provide support to global activity. Instead, the data has moved in the other direction and is likely an indication they are not isolated from the slowdown we have observed globally. A slowdown in Chinese economic activity will likely weigh on global economic activity.
Starting with the hand-off from 1Q23 to 2Q23, China Real GDP for 1Q23 came in at an annual rate of 4.5% y/y, an acceleration from 2.9% in the prior quarter. Outside the volatility caused by the pandemic, this was the weakest growth rate on record. Although the comparison set for 2Q23 eases on a y/y basis given the Omicron lockdowns, most growth measures have failed to improve meaningfully, and some have moved to outright negative in May.

Source: Macrobond.
Since the Q1 print, we have seen industrial production decelerate to 3.5% y/y in May. Industrial profits on a year-to-date y/y basis are down 20.6%, the slowest pace since the early months of the pandemic. The deceleration in industrial production and profitability likely reflects a slowdown in demand.


Source: Macrobond.
On the global demand front, we have seen exports from China decelerate to -7.5% y/y in May. Underneath that number, it is worth noting that exports to the European Union decelerated to -7.3% y/y and -18.2% y/y to the United States. In U.S. Dollar terms, the EU and U.S. are the largest recipients of Chinese exports at $44.6 billion and $42.5 billion, respectively, as of May. Both are below their cycle peaks of $53.4 billion for the EU in July 2022 and $57.4 billion for the U.S. in September 2021.


Source: Macrobond.
Over the last two months the largest y/y accelerations has been in exports to Russia, which in U.S. Dollar terms amounts to $9.5 billion. The second largest y/y acceleration has been to Africa, which amounts to $15.9 billion, larger than Russia, but still less than half of the EU and US on their own. Out of the four areas that posted positive y/y growth (Russia, Africa, South Africa, and the United Kingdom), each of them decelerated on a rate of change basis. This is another sign of a global deceleration in demand outside of a few less impactful areas in terms of value traded.


Source: Macrobond.
Manufacturing sentiment has also been weak according to the National Bureau of Statistics of China PMI. The new orders component declined to 48.3 in May, down from 48.8 in the prior month. Similarly, new export orders declined to 47.2 in May, down 47.6 in April. A reading below 50 indicates contraction and both measures were below that mark through the first two months of 2Q23.

Source: Macrobond.
Another way we can track demand is through shipping prices. When production and order growth slow, we would expect to see a decline in shipping prices. The China Containerized Freight Index peaked at 3,588 in the first quarter of 2022 and has since dropped to 927, which is in line with levels last seen during the first few weeks of the pandemic.

Source: Macrobond.
Additionally, the Producer Price Index (PPI) for China has decelerated -4.6% y/y in May and has been negative y/y for the last eight months. This is another sign of demand slowing as businesses lose the ability to charge the same high prices seen over the last two years. Eventually, those high prices become economically unviable when downstream demand slows, thus a deceleration in prices and evidence that demand has slowed.

Source: Macrobond.
To get a better view of the internal demand setup for China, we can track retail sales, imports, and the Consumer Price Index (CPI). For May, retail sales decelerated to 12.7% y/y from 18.4% in April. It is important to recall the weaker Omicron environment that this month was compared to on a y/y basis and point out that retail sales have increased at an annual rate of 2.5% y/y since May 2021.

Source: Macrobond.
The deceleration in imports is also likely a symptom of the broader demand slowdown. Through April and May, imports have declined -7.9% y/y and -4.5% y/y, respectively.

Source: Macrobond.
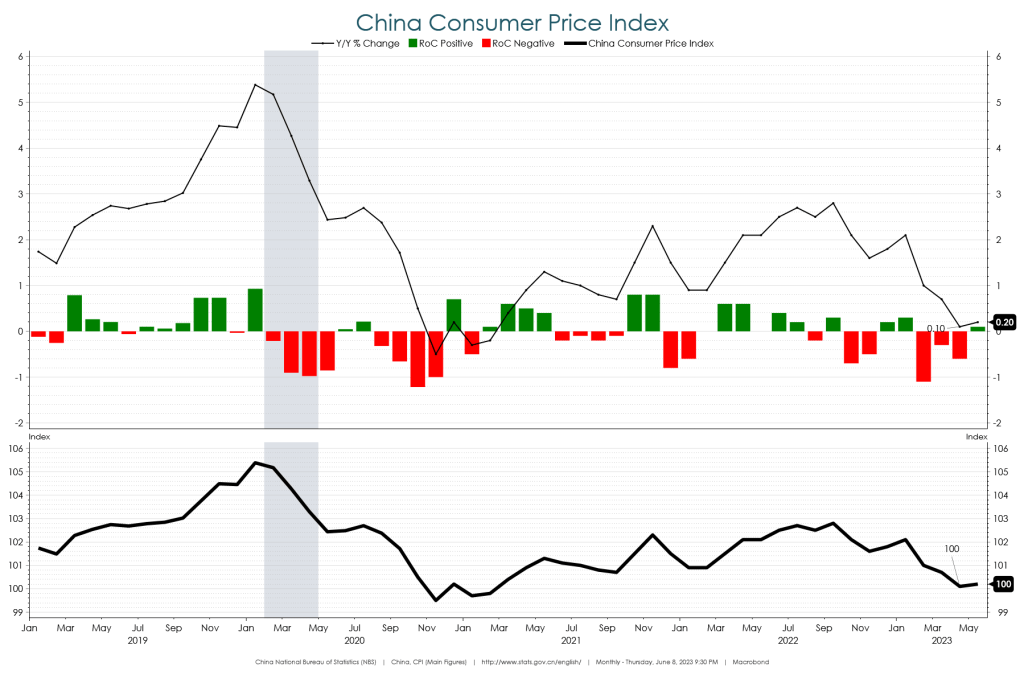
Consumer prices have also come down with the CPI for China decelerating to 0.2% y/y in May. This was up from 0.1% y/y in April but below the 2.1% growth rate registered to start the year. Like the PPI, at some point businesses cannot charge the same high prices if consumer demand declines.
Source: Macrobond.
Lastly on the broader Chinese demand setup, another sign of weakness is the -0.1% y/y print for year-to-date private fixed asset investment through the month of May. This was its first negative reading on record excluding the pandemic lows.

Source: Macrobond.
The People’s Bank of China (PBoC) has responded to the economic weakness by cutting its Medium-Term Lending Facility 1-Year Rate to 2.65% in May. To start 2022, this rate was at 2.95%. As actual economic activity has slowed and expectations have declined, the PBoC has eased policy. This is further evidence that the economic environment in China is most likely weaker than what was expected as we entered 2023.

Source: Macrobond.
As we move through 2023, credit growth in China will be important to monitor. If the easing of monetary policy is effective and the environment is improving, we would expect to see lending activity increase. For a view into credit growth, we can track outstanding loan growth which slowed to 11.4% y/y in May. This was low compared to the last decade of data and even weaker given the Omicron comparison set.

Source: Macrobond.
The major takeaway from Chinese economic data through the first half 2023 is that they are less likely to provide a lift to global economic activity. In fact, the weakness from China likely increases the probability of further decelerations in global growth and inflation.
The views expressed herein are presented for informational purposes only and are not intended as a recommendation to invest in any particular asset class or security or as a promise of future performance. The information, opinions, and views contained herein are current only as of the date hereof and are subject to change at any time without prior notice.

Investment Strategist
Boyd Watterson Asset Management, LLC