
At Boyd Watterson Asset Management, one of our core beliefs when it comes to managing fixed income portfolios is there are certain parts of the corporate credit market that offer more favorable characteristics than others. We refer to the BBB-BB rated portion of the corporate credit curve as “mid-grade,” as they fall in the middle of the investment grade and high yield market. A recent research note from investment firm Verdad highlighted many of the attractive features of the mid-grade space. We agree with many of their points and have made the mid-grade space the key source of credit risk in our fixed income portfolios. We decided to review some of the work they did to reinforce our general preference for the mid-grade space and why we do not own CCC rated securities.
We started by looking at the annual default rates from the 2018 S&P Annual Global Corporate Default and Rating Transition Study. Below you can see average annual defaults have been 0% for AAA-A rated securities, and 0.01% for BBB rated securities over the last five years and have even been below the long-term average for BB and B rated high yield securities. CCC rated securities have had an average annual default rate of 26% for the last five years, almost identical to their historical average annual default rate (going back to 1981). This is significant and highlights why we do not prefer holding CCC rated securities. A quarter of them end up not paying in any given year with a high amount of consistency. While the historical average annual default rate difference between B and BBB-BB does not look that high (3% difference), the impact to returns comes from the compounding effect over time. As seen in the five-year average cumulative default rate since 1981, B rate securities end up with close to 19% of their holdings defaulting, compared to 2% for BBB and 8% for BB. This has a large impact on the total returns over time, which will be shown later.

Source: S&P, Moody’s.

Source: S&P, Moody’s.
After identifying the default rates by year, we then reviewed the average recovery rate for senior unsecured bonds from the Moody’s 2017 Annual Default Study: Corporate Default and Recovery Rates report. These were used to determine the annual lose rate (default rate x recovery rate) and adjusted the reported index returns (using BofAML data) by that amount each year, 1998-2018 (note: for the 2018 recovery rate we used the average since 1981 as the 2018 number was not available). We then calculated annual loss adjusted returns and ran portfolio risk statistics. What immediately stands out is how much the performance decreases for CCC rated securities. The annual loss adjusted total returns is lower than all of the other high yield rated and BBB securities during the relevant time period. They also have the largest gap between their average yield and their loss adjusted returns. The average annual loss rate for CCC rated securities was 16.5%, compared to 2.3% for B, 0.4% for BB, and 0.13% for BBB. The only categories CCC rated securities led in are highest volatility and drawdown. We can also see that during the review period the mid-grade space has achieved higher loss adjusted returns than the AAA-A rated securities, while still having relatively an attractive risk/return profile. BBB rated securities are the lowest rated credit tier to achieve loss adjusted returns above their average yield, owed mainly to their very low default rates.
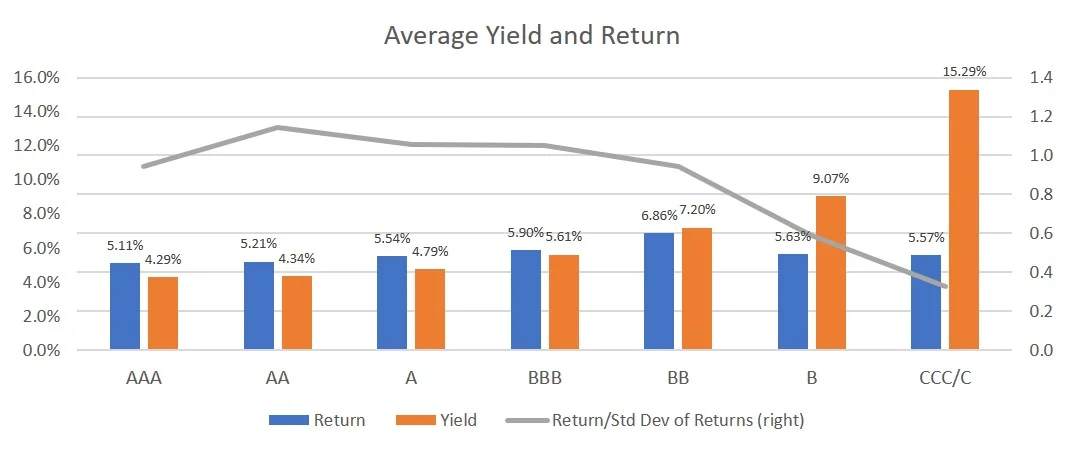
Source: ICE BofA Merrill Lynch.

Source: ICE BofA Merrill Lynch.
This analysis should help explain why we focus on the mid-grade portion of the credit risk curve in our portfolios and continue to avoid owning CCC rated securities. We think the mid-grade space offers a better risk return profile and a loss adjusted return that is more in-line with the starting yield.
The views expressed herein are presented for informational purposes only and are not intended as a recommendation to invest in any particular asset class or security or as a promise of future performance. The information, opinions, and views contained herein are current only as of the date hereof and are subject to change at any time without prior notice.

Senior Vice President, Investment Strategy
Boyd Watterson Asset Management, LLC