
The two main reasons we monitor the housing market are for insights into the rates of change in prices and what it could mean for the Shelter component of CPI (which could impact Fed policy) and more broadly as a view into the consumer demand setup (price/rate sensitivity) through transaction volume. Both indicators should help us identify slowdowns in the housing market which have historically reflected the weakening trends in underlying economic activity.
On the inflation front, over the near-term, we would expect to see the positive contribution of Shelter to move lower as the lagged impact of sequential decelerations in home prices make their way through that data set. With that said, we have seen home prices re-accelerate y/y in the last two months, which could impact CPI in the second half of 2024 depending on their direction from here.


Source: Macrobond.
In terms of demand, there has been historically weak transaction volume for existing single-family homes. While there has been a downward shift in overall transaction volume over the last decade, the negative y/y growth we have seen since late 2021 through today is only comparable to the period from 2006 to 2008. There are several factors to consider here, but one of the major takeaways is the inability or unwillingness of consumers to buy existing single-family homes.

Source: Macrobond.
Another way we can measure consumer rate sensitivity is by looking at the relationship of the MBA Purchase Applications Index compared to mortgage rates. This index began accelerating to the downside at the end of 2021 just before the Fed started to raise its target rate and mortgage rates moved from 3.47% in December 2021 to 7.54% today.

Source: Macrobond.
Despite the hiking cycle, the median sales price of an existing single-family home is back near all-time highs. Again, there are several factors here, but inventory levels remain historically low which has probably helped keep prices higher.


Source: Macrobond.
On the sentiment side, consumers’ expectations to move just hit its third lowest level on record and personal finance sentiment remains in a negative trend. The higher price, higher rate, and weaker consumer income dynamic has probably contributed to the downside in these sentiment measures. Notably, the Housing Affordability Index, which considers median household incomes and monthly mortgage payments on a median priced home, is at its lowest level since the mid-1980s.


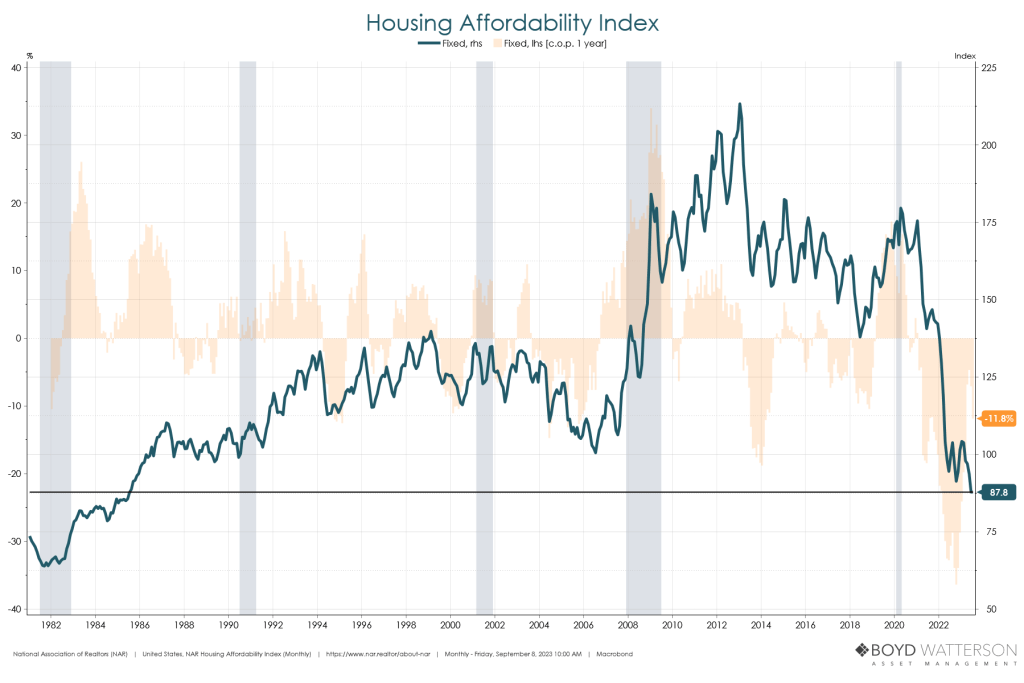
Source: Macrobond.
On the market side, the iShares U.S. Home Construction ETF is now down 13% from its recent cycle high. Also, the 2y10y Treasury yield curve remains inverted which has historically been a good signal for a pending slowdown in economic growth and inflation.


Source: Macrobond.
One noteworthy component left out of this analysis is the shift to multi-family housing by preference or necessity, which we will cover in a future post. As we move into the fourth quarter of 2023, we will continue to monitor the housing market as it provides useful insight into key underlying economic trends.
The views expressed herein are presented for informational purposes only and are not intended as a recommendation to invest in any particular asset class or security or as a promise of future performance. The information, opinions, and views contained herein are current only as of the date hereof and are subject to change at any time without prior notice.

Investment Strategist
Boyd Watterson Asset Management, LLC