
Going back to January, we expected to see a continued slowdown in economic activity. We observed a deceleration across consumption, production, and order growth throughout 2022 and noted we would likely see a deceleration in GDP if that trend were to hold. The q/q seasonally-adjusted annualized rate (SAAR) came in at 1.1%, a deceleration from 3.2% in 3Q22 and 2.6% in 4Q22. The y/y growth rate accelerated in 1Q23 to 1.6% compared to 0.9% in 4Q22. However, we believe the driving factors causing that acceleration are unlikely to repeat in 2Q23 as most of the increase was from January data while February and March data mostly slowed.

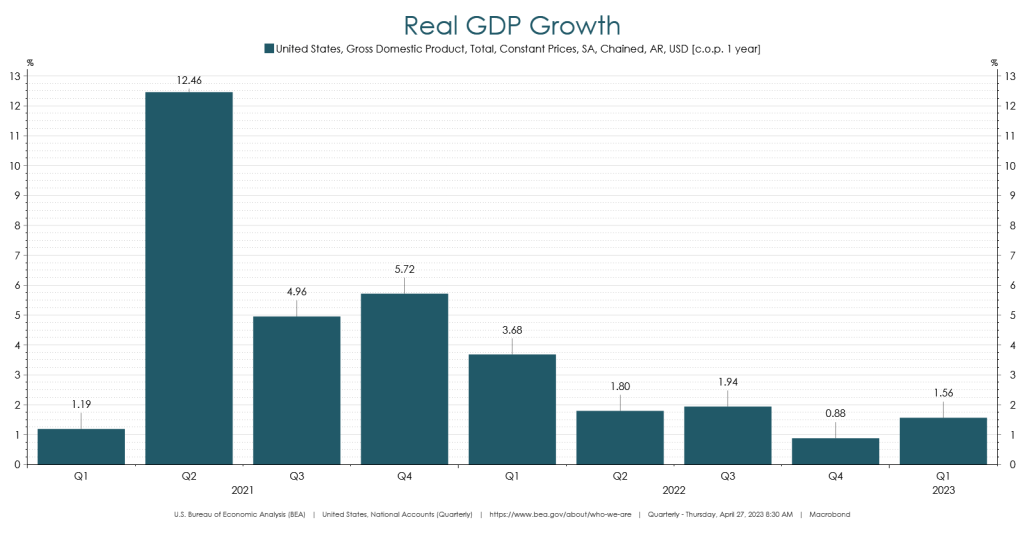
Source: Macrobond.
It is important to peel back the layers of each component that make up the headline print. The contribution breakdown for 1Q23 was as follows:
- Personal Consumption Expenditures: +2.5 percentage points
- Gross Private Domestic Investment: -2.3 percentage points
- Net Exports: +0.1 percentage points
- Government Spending: +0.8 percentage points

Source: Macrobond.
On the surface, personal consumption expenditures (PCE) had a strong quarter, up 3.7% q/q at an annualized rate. Most of that gain came from Motor Vehicles and Parts, increasing at an annualized rate of 45.3% q/q, contributing 1.1 percentage points to headline GDP. Considering the trend in other measures of spending, we would expect this to have less of a positive contribution in 2Q23. If you look at the monthly headline PCE series on a y/y basis, it decelerated from 2.6% in January to 2.2% in February and 1.9% in March. Given the broader uptick in January data, the final tally for 1Q23 indicates how weak the rest of the quarter was in most categories outside of Autos.


Source: Macrobond.
Gross private domestic investment fell to an annualized rate of -12.5% q/q from 4.5% last quarter. On a y/y basis, GPDI decelerated to -8.2%, its slowest pace since 2Q20. Underneath that, the nonresidential component declined to 0.7% q/q and residential was down -4.2% q/q. Nonresidential and residential investment also decelerated on a y/y basis to 2.7% and -19.0%, respectively. The inventories component of GPDI had a -2.3 percentage point drag on headline GDP. Moving to 2Q23, we believe it is unlikely there will be a meaningful increase in inventories based on what we have been hearing on the demand side from retailers and transportation companies over the last few months, and therefore it is unlikely for inventories to provide a positive lift to GDP in 2Q23. If inventories do increase, we would expect to see a decrease in corporate profitability as consumer demand slows.


Source: Macrobond.
On the trade side, imports decelerated to -2.0% y/y while exports accelerated to 7.1% y/y. Away from the GDP calculation, the trend in imports since 2Q22 has been negative, reflecting a slowdown in domestic demand. Goods imports have decelerated sequentially for four consecutive quarters, moving to -2.9% y/y in 1Q23. Services imports have followed a similar path as goods but remain positive at 2.7% y/y.


Source: Macrobond.
Our takeaway from what happened in 1Q23 was that the January spending data had an outsized, one-off positive impact on headline GDP. This setup likely makes the hand-off to 2Q23 more difficult as economic data resumes its downward trend.
The views expressed herein are presented for informational purposes only and are not intended as a recommendation to invest in any particular asset class or security or as a promise of future performance. The information, opinions, and views contained herein are current only as of the date hereof and are subject to change at any time without prior notice.

Investment Strategist
Boyd Watterson Asset Management, LLC