
Retail and food services sales for the month of January accelerated 2.96% m/m, following -1.09% in December and -1.07% in November. The largest acceleration came from department stores (+17.52% m/m), followed by food services and drinking places (+7.19% m/m), and automobiles (+6.45% m/m).

Source: Macrobond.
Since the pandemic started, we have seen similar accelerations in January retail sales data which could be the result of seasonal adjustments that do not properly capture the current environment. There have been large m/m increases in the last three January prints but relatively weaker growth rates throughout the rest of the year. This could be due to pandemic-induced hiring variability or changes in consumer spending habits that cause the m/m seasonally-adjusted comparison to be less comparable between December and January. Within the underlying components, the department store data highlights this trend. In January 2021, department store sales accelerated 19% and failed to get above 1% for most of the year, excluding March which was the same month the American Rescue Plan fiscal payments were deployed. Moving to January 2022, department store sales accelerated 11% and only made it above 1% in September.


Source: Macrobond.
Additionally, most of the y/y increases in headline retail sales data have been attributable to price growth. On an inflation adjusted basis, real retail sales are almost 2% lower compared to where they were in March 2021. Over that same time period, nominal retail sales are up by 11% and the Consumer Price Index is up by more than 13%. Looking at the latest y/y comparison, nominal retail sales accelerated 6.38% while real retail sales came in at 0.03%. With the latest headline CPI at 6.35% y/y, the consumer effectively purchased the same quantity of goods this January as they did last January but paid 6% more.


Source: Macrobond.
Another way we can track expectations for demand is from the production side. If demand was as positive as the latest retail sales report would suggest, we would likely see the inventory-to-sales ratio move lower. Instead, we have seen the I/S ratio increase to a level last seen in November 2020. Additionally, if businesses were turning over their inventory and expected increased demand, then industrial production should be improving. Neither of those indicators are moving in the right direction.
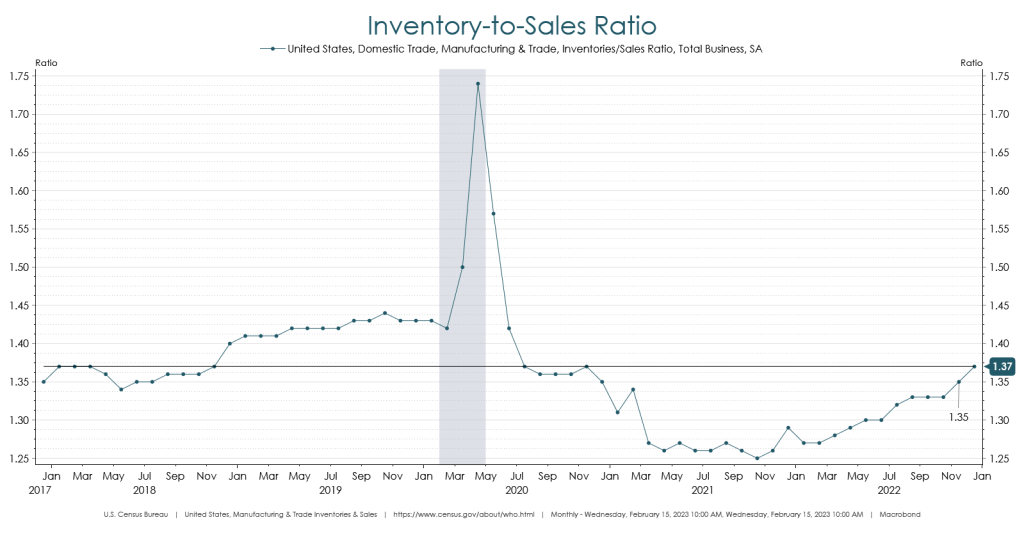

Source: Macrobond.
We will continue to monitor this dynamic as consumer spending and production levels have broad implications for the direction of the rest of the economy. Currently, the trend in real retail sales, increase in the I/S ratio, and slowdown in production suggest consumer demand may be weaker than what the headline retail sales print implies.
The views expressed herein are presented for informational purposes only and are not intended as a recommendation to invest in any particular asset class or security or as a promise of future performance. The information, opinions, and views contained herein are current only as of the date hereof and are subject to change at any time without prior notice.

Investment Strategist
Boyd Watterson Asset Management, LLC