
The Consumer Price Index (CPI) made a new cycle high in May, increasing at 8.6%. Shelter is the largest overall category in the CPI (32%) and Owners’ Equivalent Rent (OER) is the largest component of the shelter category (24%). OER is an attempt to capture homeowners’ housing consumption by calculating what they think they could charge for renting their home. OER increased by 5.1% on a year-over-year basis in May, the fastest growth rate since the early 1990s, and up from a low of 2% in March 2021. The direction and pace of growth for OER will be a major determining factor in what happens to the overall CPI.

Source: Macrobond.
Research firm Hedgeye Risk Management did an analysis on OER and home prices and found that since 1991, OER has a high correlation to home prices, but on a lag. OER tends to peak 12-15 months following the peak in home prices (using the Case-Shiller National Home Price Index). The shaded area in the chart below highlights that relationship.

Source: Hedgeye.

Source: Macrobond.
The Case-Shiller Home Price Index is a measure of home prices across major metros areas, calculated using a rolling three-month average, and comes out on a lag. The March update (most recent) showed home prices growth accelerated to a 20.5% year-over-year growth rate, a record high. The annual rate of change has been stable around 19-20% since July of 2021. Using the 12-15 month lag as a projection for where OER could be headed shows that some of the strongest accelerations are coming up in the next four to seven months. The rate of change in home prices in December 2020 (15 months ago) was 10.4%, rising to just under 20% by August 2021. The rate of change in March 2021 (12 months ago) was 13.5%.

Source: Macrobond.
If the previous relationship between home prices and OER holds, it means that OER could increase for the remainder of 2022 before going sideways. This could keep the contribution from OER to the overall CPI elevated. Beyond 2022 will depend in part on what happens to home prices. The data on the housing market for more recent periods than March suggest that housing activity is slowing, which could lead to slower price growth.
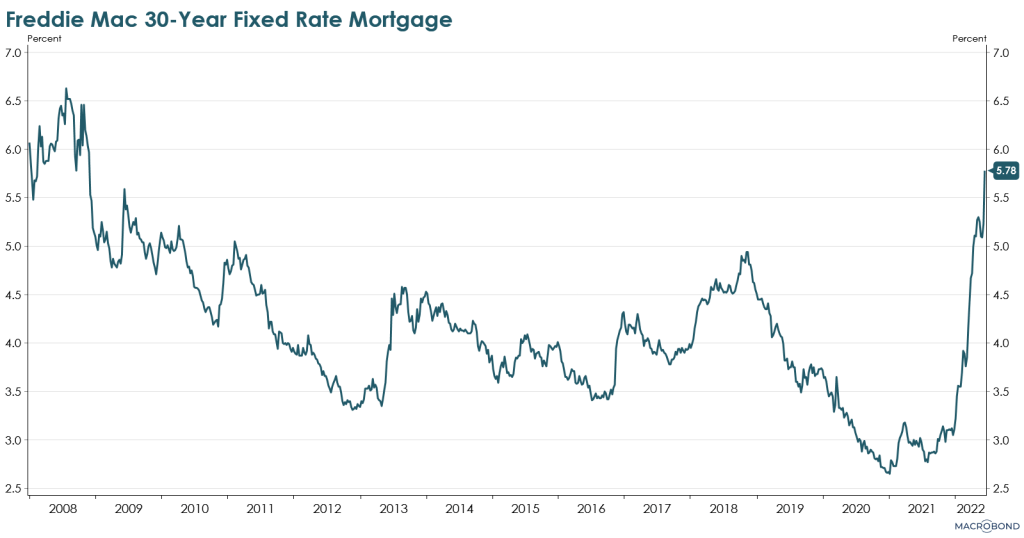
One of the most direct impacts on housing activity is mortgage rates, which have recently increased to just under 5.8%, the highest level since 2008, and more than double the 2.8% level from August 2021.

Source: Macrobond.
The rise in mortgage rates has also contributed to a decline in mortgage refinance applications, with activity at the start of June dropping to the lowest level in 22 years. Similarly, mortgage purchase applications have been declining at a faster rate since the beginning of 2022 and remain below their January 2021 peak.


Source: Macrobond.
Housing construction has slowed along with the rise in the mortgage rates. Single-family building permits (a leading indicator for future home building) declined to a seasonally adjusted annual rate of 1.048 million in May. That was the lowest level since July 2020, an 8% year-over-year decline, and a 13% decline from the February 2022 level.

Source: Macrobond.
Single-family housing starts have been slowing with the May seasonally adjusted annual rate declining to 1.051 million, the lowest level since February 2021. That was a 5.3% year-over-year decline and a 19.6% decline from the December 2020 level.

Source: Macrobond.
Sales of homes are also showing signs of weakness, for new and existing properties. New home sales in April declined to a seasonally adjusted annual rate of 591,000. This is the lowest level since April 2020, a 27% decline from a year ago, and a 43% decline from the August 2020 high.

Source: Macrobond.
Existing home sales in April declined to a seasonally adjusted annual rate of just under 4.8 million. This is the lowest level since June 2020, down -7.7% versus last year at this time, and a -18.6% decline from its January 2021 peak.

Source: Macrobond.
If interest rates remain elevated and housing activity continues to decline, home price appreciation will likely slow, which should bleed into the OER component of the CPI in the next 6-9 months.
The views expressed herein are presented for informational purposes only and are not intended as a recommendation to invest in any particular asset class or security or as a promise of future performance. The information, opinions, and views contained herein are current only as of the date hereof and are subject to change at any time without prior notice.

Senior Vice President, Investment Strategy
Boyd Watterson Asset Management, LLC