
There has been a recent bout of volatility in the oil and commodity market that has also impacted parts of the equity market. When these bouts of volatility occur, they end up being a sign of a transition into a different environment, or they turn out to be temporary and the prior trend continues. We can never know for sure in the moment since we cannot predict the future. What we do know is that by looking at a broad range of economic and market-based indicators, we are able to see if a large number of indicators are signaling a change or if the problems are isolated to a certain area of the market/economy.
Looking at economic data, there was some weakness across a broad range of data in February, including retail sales, home sales, durable goods, and industrial production. Most of the weakness in February is being attributed to the unusually cold weather in many parts of the southwest and the southeast (most notably Texas). We will have to see if that continues in March and starts to become more than a seasonal problem.
Last week, the March Markit Flash PMI report for U.S. Manufacturing and Services was released. Both increased month-over-month (MoM) and remain at elevated levels. Order activity, or demand, remained strong and delivery delays, or supply, remained an issue, putting upward pressure on price expectations. This is an early look at the post February weather situation, and so far, the positive trends are still in place.
Another important macro trend to keep in mind is the upcoming comparison set. The U.S. went into strict lockdowns in March and April of 2020 to try and address the spread of COVID-19, which led to a sizeable decline in economic activity. In the coming months, the economic data being released will be compared to those weak periods, leading to large gains in the year-over-year (YoY) trend. This makes it unlikely that economic activity is going to slow on trend basis over the next few months.

Source: Bloomberg.
From a market standpoint, we like to look across asset classes and below the surface of price action by evaluating volatility and volume. Starting with the currency market, the U.S. Dollar Index (DXY) has been increasing throughout the month of March after reaching a bottom in early January.

Source: Koyfin.
Recently, the performance of the USD has increased versus most developed market currencies, but defensive areas like the Swiss franc (CHF) and the Japanese yen (JPY) have been weaker than the Canadian dollar (CAD) and the Norwegian krone (NOK).

Source: Koyfin.
On the emerging market side, some countries have had some idiosyncratic problems (Turkey and Brazil), but many emerging market currencies are up against the USD in the last six months and have been trending sideways recently.

Source: Koyfin.
If we were heading into a period of weak economic activity and tighter liquidity conditions, emerging market currencies would most likely be declining against the USD.
Moving to fixed income, ten-year interest rates in France and Germany have declined in the month of March after increasing since November of 2020. Some of the recent weakness could be related to the COVID-19 situation in these countries and the limited amount of mobility that continues. Vaccine deployment should start to increase in Europe, which should help, and is something we will continue to monitor. While the absolute level of interest rates is still low, they are well above the prior lows in 2020.

Source: Koyfin.
Ten-year interest rates in the United Kingdom and Australia have declined in recent weeks but had been moving steadily higher from November to February. Even with the recent decline, rates in the United Kingdom are near the highest since January 2020, while Australia rates are near the highest since mid-2019.

Source: Koyfin.
Ten-year interest rates in the U.S. are down slightly from their recent high but have been steadily increasing since August 2020 and are near the highest level since February 2020.

Source: Koyfin.
The ten-year rates across the developed world suggest that the long-term trend of improvement in 2021 versus 2020 is still in place.
One part of the U.S. rates market we will continue to monitor is shorter term matures. Shorter term U.S. Treasuries play an important role in the leveraged finance market as they are the highest quality form of collateral and are most in demand when lending and liquidity conditions are tightening. Until the most recent week, interest rates for one year and under Treasuries had been declining, potentially signaling an increase in demand for these high-quality collateral assets. If this trend were to continue, it could likely be an early warning sign of a pullback in funding and liquidity conditions that can have negative implications for investment markets.

Source: Koyfin.

Source: Koyfin.
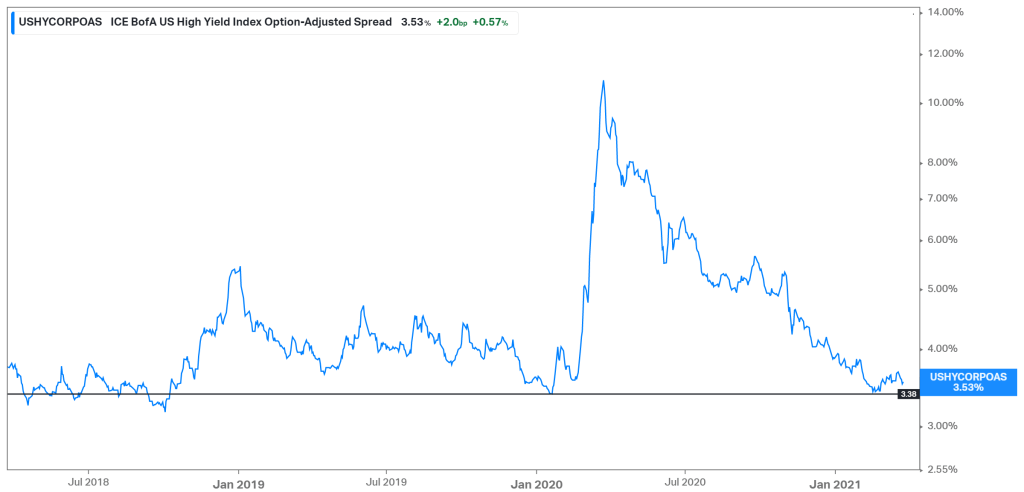
On the credit side of fixed income, high yield spreads are up from their lows in February 2021 but have been declining consistently since November 2020 and are near the levels they were prior to the pandemic.
Source: Koyfin.
If economic activity was expected to decline on a sustained basis, the increased risk to corporate profits should get priced into high yield markets.
On the equity market side, the S&P 500 Index closed at a new all-time high on March 26th.

Source: Koyfin.
The Russell 2000 small cap index is 6% below its all-time closing high set on March 15th.

Source: Koyfin.
From an industry standpoint, performance has been mixed over the last month, as cyclicals like Industrials and Materials have outperformed, along with defensive and interest sensitive areas like Utilities, Consumer Staples, and Real Estate.

Source: Koyfin.
On a three-month basis, cyclicals are leading as Energy, Financials, Industrials, and Materials are the best performing industries.

Source: Koyfin.
Another trend we monitor is the return between equal-weight industry indexes and market cap-weighted indexes. Performance trends among these indexes highlights if there is broad participation across industry returns or if the largest companies are driving industry and market returns. Looking at the last three months, the equal-weighted S&P 500 (RSP) is outperforming the market cap-weighted (SPY). This is mainly due to the underperformance of mega-cap Discretionary companies (Tesla and Amazon), Technology companies (Apple and Microsoft) and Communications companies (Facebook and Google).

Source: Koyfin.
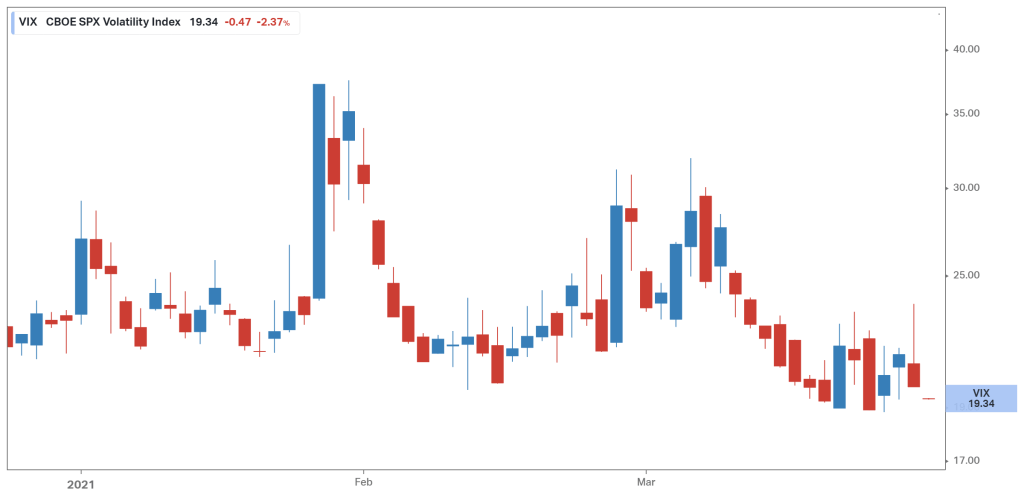
Looking at equity market volatility, there have been a few spikes in volatility so far in 2021, each one lasting for a few days and then eventually declining. The VIX Index closed at 19.34 on March 26th. The VIX Index has only closed below 20 on a few occasions since February 2020. If this trend holds and the VIX Index continues to move into the teens, this would be a positive sign for equity markets.
Source: Koyfin.
We also monitor the volume of equity markets to see if positive or negative trends are developing during periods of accelerating or decelerating volume. The S&P 500 index volume had been relatively low and decelerating over the last two weeks but accelerated to end the week on March 25th and 26th.

Source: Yahoo Finance.
Finally, commodity prices have declined from their recent highs with most of the action taking place in the oil market. West Texas Intermediate (WTI) peaked on March 8th and is down approximately 6.5% from the close on that day. At over $60, WTI prices are still near the highest level since January 2020.

Source: Koyfin.
Oil volatility has increased during this period but started to decline at the end of the week. This will be an important trend to monitor.

Source: Koyfin.
The broad commodity index (DBC) peaked on March 11th and is down approximately 4.5% from the close on that day. This index is also near the highest level since January 2020.

Source: Koyfin.
Other commodities like copper, agriculture, and the broad metal index have also declined in recent weeks but are still near multi-year highs.

Source: Koyfin.

Source: Koyfin.

Source: Koyfin.
Reviewing all these economic and market data points suggests that while there has been some near-term weakness that has created some activity to monitor, the positive trends that have been in place since November still remain, and we expect that to continue.
The views expressed herein are presented for informational purposes only and are not intended as a recommendation to invest in any particular asset class or security or as a promise of future performance. The information, opinions, and views contained herein are current only as of the date hereof and are subject to change at any time without prior notice.

Senior Vice President, Investment Strategy
Boyd Watterson Asset Management, LLC