Mon - Fri 8:00am-4:45pm (216) 771-3450

How does this bear market rally compare to history?

Print Friendly, PDF & Email

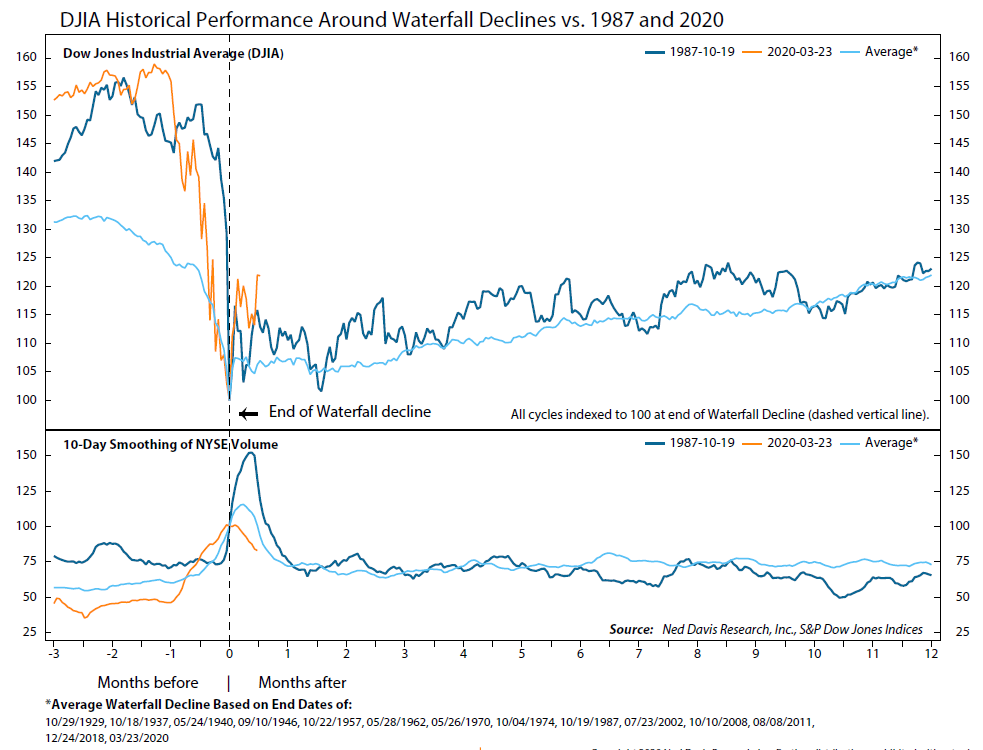
In a prior post, we discussed what happens during a bear market, based on the four phases that Ned Davis Research (NDR) uses (oversold, rally, retest, and breadth thrusts).  Since March 23rd, we have been in the rally phase, as the S&P 500 is up over 24% through the close on April 9th.  In fact, compared to prior bear market rallies, this period has been the fastest to reach 20%+ returns from the bottom of the initial selloff (end of oversold phase).

Copyright 2020 Ned Davis Research, Inc. Further distribution prohibited without prior permission. All Rights Reserved. See NDR Disclaimer at www.ndr.com/copyright.html . For data vendor disclaimers refer to www.ndr.com/vendorinfo/ .
Copyright 2020 Ned Davis Research, Inc. Further distribution prohibited without prior permission. All Rights Reserved. See NDR Disclaimer at www.ndr.com/copyright.html. For data vendor disclaimers refer to www.ndr.com/vendorinfo/.As mentioned in the prior post on bear market phases, the industries that typically perform best during the rally phase include a combination of defensive areas and those that were most oversold (performed the worst during the initial selloff).  From the peak in February to the low on March 23rd, Energy was down 56%, Financials were down 44%, Industrials were down 42%, Real Estate was down 41%, and Materials were down 37%.  From the bottom on March 23rd through the close on Thursday April 9th, Energy was up 43.5%, Real Estate was up 38.5%, Utilities were up 35%, Materials were up 33.5%, Financials were up 32.5%, and Industrials were up 28.5%.  This follows the path of prior bear market rallies, as the worst performing industries and defensive Utilities have outperformed while the industries that performed the best in the initial selloff have lagged.This rally has produced the added bonus of generating some positive volume and market breadth indicators as volume increased on days when the S&P 500 had a positive return, upside volume exceeded downside volume, and over 90% of the NDR Multi-Cap universe is above their 10-day moving averages. 

Copyright 2020 Ned Davis Research, Inc. Further distribution prohibited without prior permission. All Rights Reserved. See NDR Disclaimer at www.ndr.com/copyright.html . For data vendor disclaimers refer to www.ndr.com/vendorinfo/ .

Copyright 2020 Ned Davis Research, Inc. Further distribution prohibited without prior permission. All Rights Reserved. See NDR Disclaimer at www.ndr.com/copyright.html. For data vendor disclaimers refer to www.ndr.com/vendorinfo/.
Copyright 2020 Ned Davis Research, Inc. Further distribution prohibited without prior permission. All Rights Reserved. See NDR Disclaimer at www.ndr.com/copyright.html . For data vendor disclaimers refer to www.ndr.com/vendorinfo/ .
Copyright 2020 Ned Davis Research, Inc. Further distribution prohibited without prior permission. All Rights Reserved. See NDR Disclaimer at www.ndr.com/copyright.html. For data vendor disclaimers refer to www.ndr.com/vendorinfo/.
Source: Yahoo Finance.Source: Yahoo Finance 

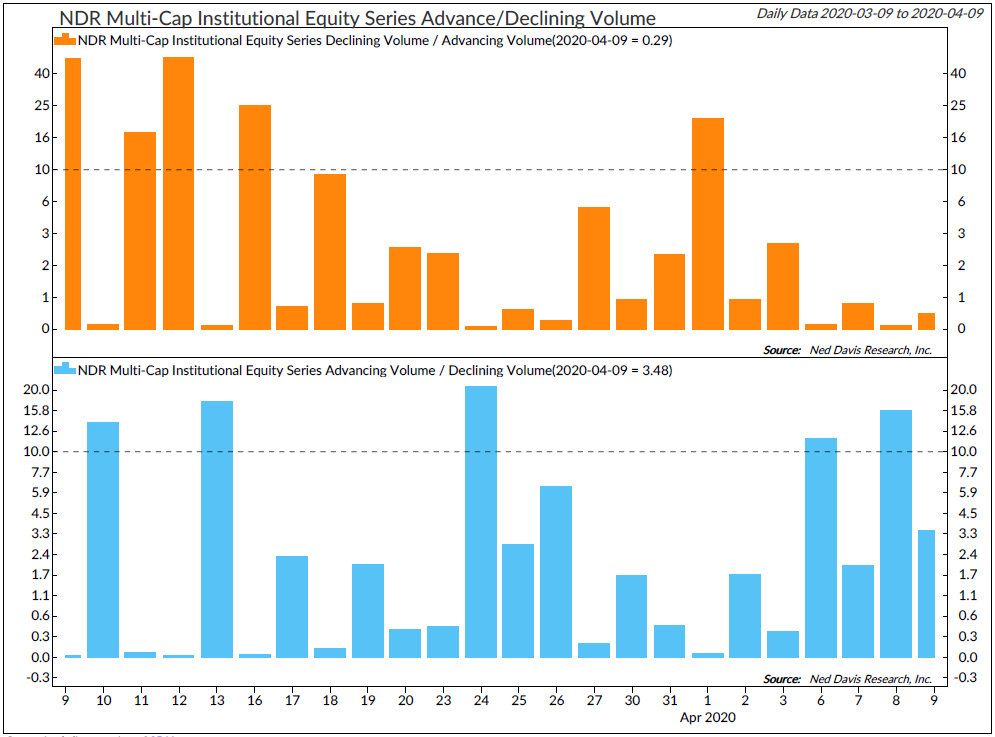
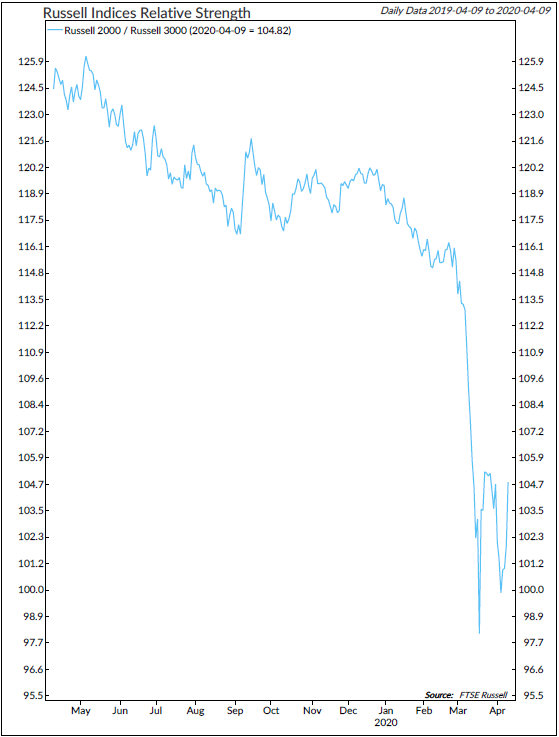
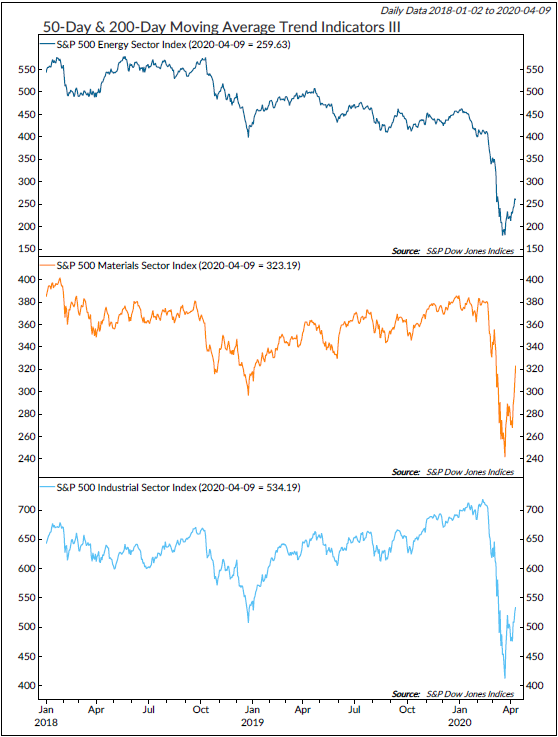
This rally could be short lived as earnings season starts and investors get the first look at the impact the economic shutdown has had, how companies have responded, and what the future impact might be.  From a market signal standpoint, it would be a positive to see continued improvements in the volume indicators and early cycle equity markets like small caps and cyclicals get back to new highs and maintain leadership.  Without these conditions, the next phase is likely the retest.   

Copyright 2020 Ned Davis Research, Inc. Further distribution prohibited without prior permission. All Rights Reserved. See NDR Disclaimer at www.ndr.com/copyright.html . For data vendor disclaimers refer to www.ndr.com/vendorinfo/ .
Copyright 2020 Ned Davis Research, Inc. Further distribution prohibited without prior permission. All Rights Reserved. See NDR Disclaimer at www.ndr.com/copyright.html. For data vendor disclaimers refer to www.ndr.com/vendorinfo/.

Copyright 2020 Ned Davis Research, Inc. Further distribution prohibited without prior permission. All Rights Reserved. See NDR Disclaimer at www.ndr.com/copyright.html . For data vendor disclaimers refer to www.ndr.com/vendorinfo/ .

Copyright 2020 Ned Davis Research, Inc. Further distribution prohibited without prior permission. All Rights Reserved. See NDR Disclaimer at www.ndr.com/copyright.html. For data vendor disclaimers referto www.ndr.com/vendorinfo/Copyright 2020 Ned Davis Research, Inc. Further distribution prohibited without prior permission. All Rights Reserved. See NDR Disclaimer at www.ndr.com/copyright.html . For data vendor disclaimers refer to www.ndr.com/vendorinfo/ .

Copyright 2020 Ned Davis Research, Inc. Further distribution prohibited without prior permission. All Rights Reserved. See NDR Disclaimer at www.ndr.com/copyright.html. For data vendor disclaimers refer to www.ndr.com/vendorinfo/.


The views expressed herein are presented for informational purposes only and are not intended as a recommendation to invest in any particular asset class or security or as a promise of future performance.  The information, opinions, and views contained herein are current only as of the date hereof and are subject to change at any time without prior notice.